Sun on a Raspberry Pi
July 7th. The factory floor at Scatolificio Sampolese, where cardboard boxes and packaging come off the line at a steady rhythm. Outside, on the roof, a 100 kWp photovoltaic plant has been quietly doing its job for a while now.
The panels were there. The inverter was there. The energy was flowing.
What was missing was a way to see it.
The Problem
Scatolificio Sampolese had invested in solar — a serious installation, not a token gesture — but the monitoring experience left a lot to be desired. Generic portals, clunky interfaces, data buried behind logins that nobody wanted to open. For a production facility that runs on tight margins and constant attention, energy isn’t a nice-to-have metric. It’s operational.
They needed something they could glance at from the office, from the production floor, from a tablet on the wall. Something that answered the questions that actually matter:
- How much are we producing right now?
- How much did we make today?
- How much went to the grid, and how much did we use ourselves?
- Is the plant healthy?
Not a spreadsheet. Not a vendor dashboard designed for everyone and no one. A view built for them.
The Approach
The constraint I liked most was the hardware budget. This didn’t need a server rack or a cloud subscription with a monthly invoice. It needed to be accessible — in every sense of the word.
So I built it around a Raspberry Pi.
Small, silent, always on, cheap enough that replacing it isn’t a project in itself. The entire dashboard runs locally on the Pi, pulling data from the plant’s monitoring system and serving a custom web interface that anyone on the network can open in a browser. No app to install. No account to create. Just a URL on the wall.
The stack, in short:
- Raspberry Pi as the always-on host
- A custom web dashboard with real-time and historical data
- Live gauges for instantaneous power and daily energy breakdown
- Trend charts for production, grid injection, and self-consumption across the day
- A plant summary with lifetime totals, monthly output, and self-consumption rate
The Dashboard
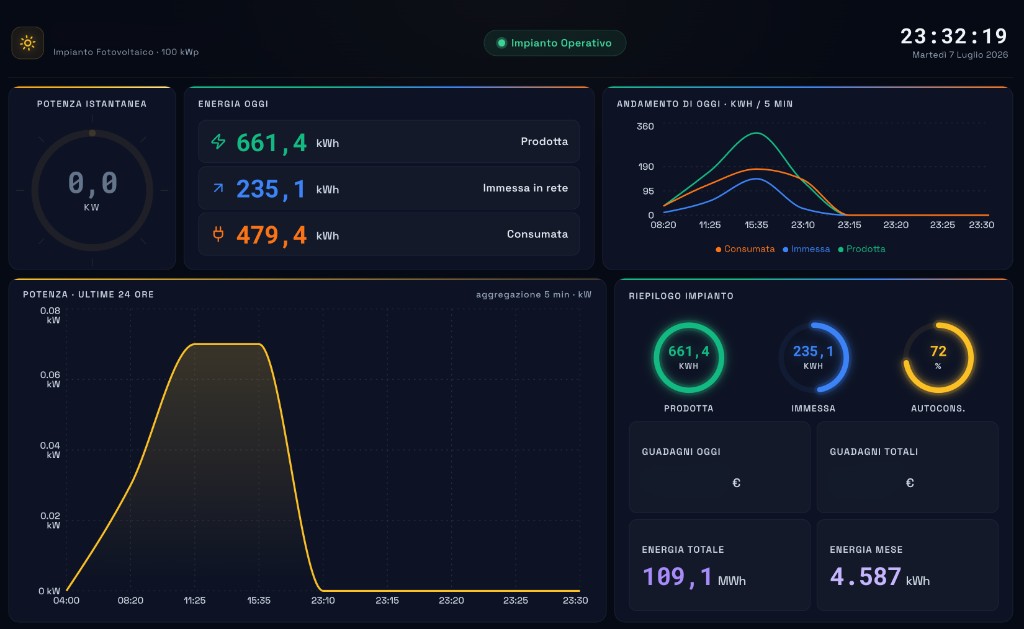
The interface is designed to be read in seconds, not studied for minutes.
On the left, a large gauge shows instantaneous power — the pulse of the plant right now. In the center, today’s energy at a glance: produced, fed into the grid, consumed on site. On the right, a trend chart traces how those three lines moved through the day, so you can spot peaks, dips, and anomalies without digging.
Below, a 24-hour power curve gives the full picture of the plant’s daily rhythm — sunrise to sunset, plateau to shutdown. And in the summary panel, circular gauges break down production, grid injection, and self-consumption percentage, alongside lifetime and monthly totals.
The visual language is deliberate: green for production, blue for grid, orange for consumption. Dark background, clean typography, glass-like panels. It looks like it belongs on a screen in 2026, not like it was bolted onto a legacy SCADA system from 2006.
On a day like today — over 660 kWh produced, 72% self-consumed — you can see immediately that the plant isn’t just generating electricity. It’s feeding the factory.
Why It Matters
There’s a pattern I keep running into: companies invest in infrastructure — solar, IoT, automation — and then stop at the default software that came in the box. It works, technically. But it doesn’t fit. It doesn’t sit on a wall where the production manager can see it. It doesn’t speak the language of the people who actually need the data.
Building something custom on a Raspberry Pi flips that equation. The hardware costs less than a decent dinner for two. The software can be exactly what you need — no more, no less. And when something needs to change, you’re not waiting on a vendor’s roadmap.
For Scatolificio Sampolese, watching every kilowatt-hour, that difference isn’t cosmetic. It’s operational.
The Result
The dashboard is live. It runs quietly on a Pi somewhere in the building, refreshing data in real time, ready for anyone who walks past the screen.
No subscriptions. No cloud lock-in. No compromise on what matters.
Just the sun, a small computer, and a clear picture of what’s happening on the roof.
Sometimes the most powerful monitoring solution is the one that fits in your palm — and on your wall.